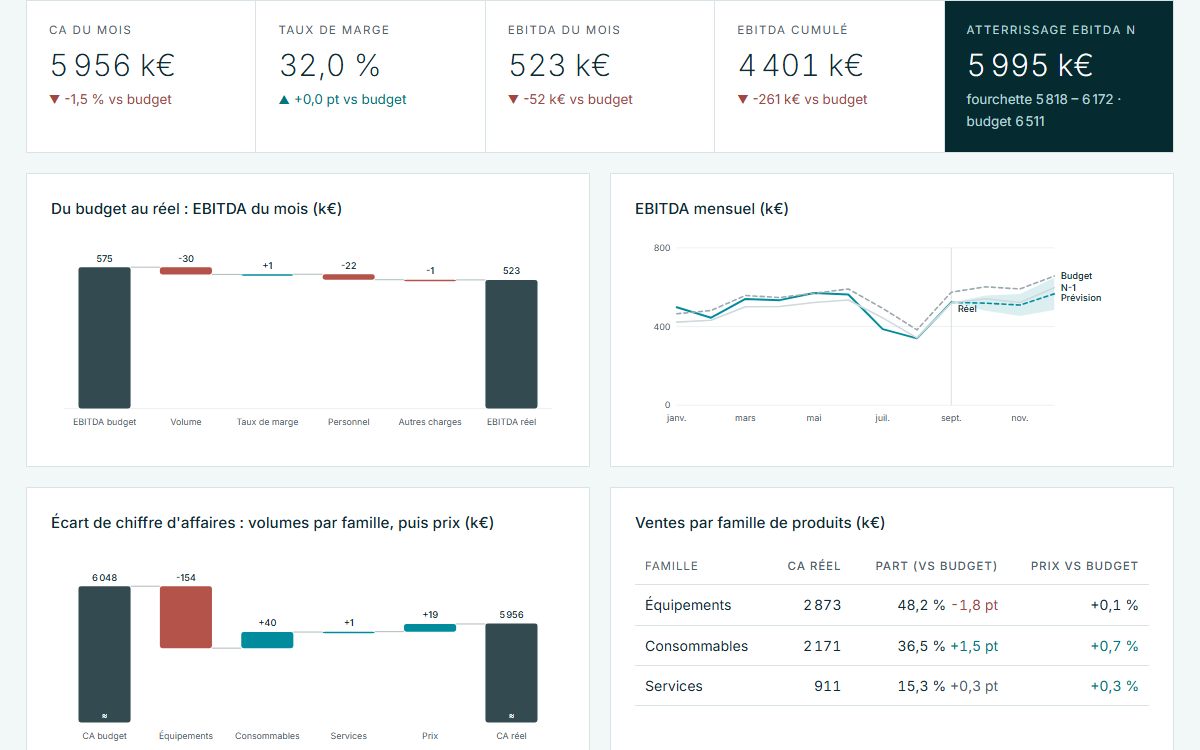
Actual, budget and prior-year P&L by subsidiary, revenue variance split by product family and price, full-year landing with its range, automatically generated variance commentary.
Cases
Work and demos
A library of demos, on fictitious data, of the set-ups we deploy for our clients. Client case studies will be published shortly.
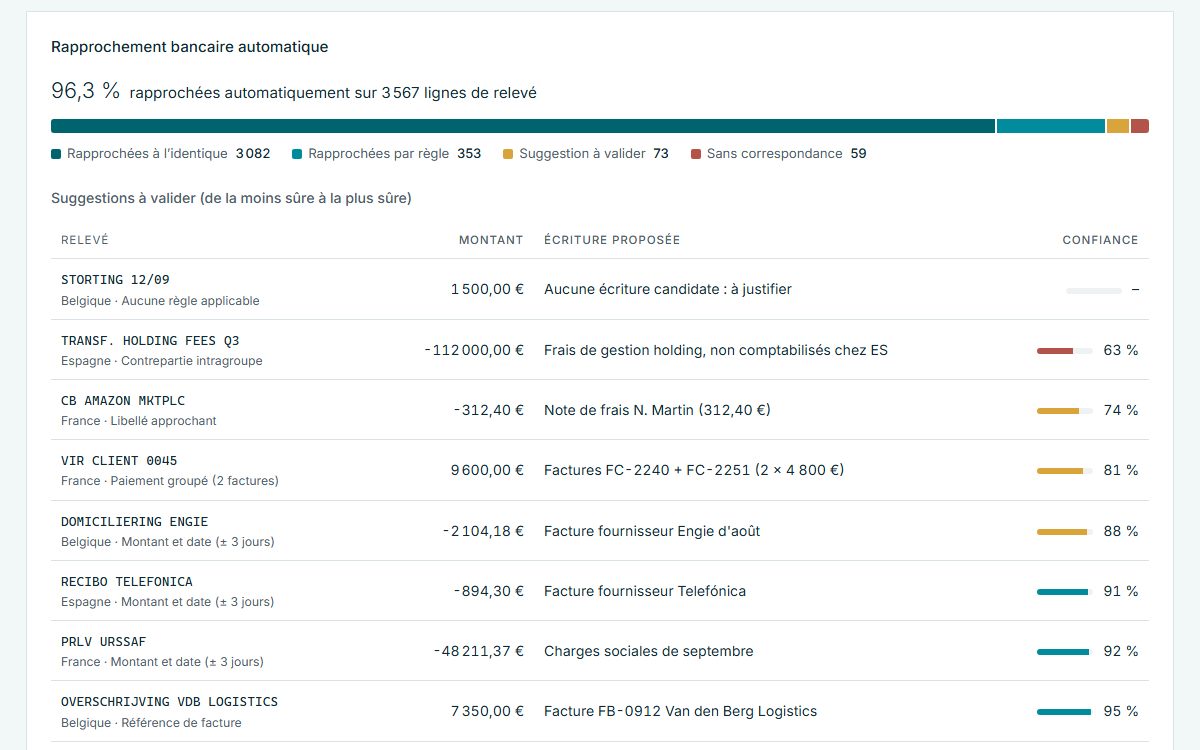
Rule-based automatic bank reconciliation, suggestions scored by confidence, an intercompany matrix that isolates gaps, task progress and close duration over 12 months.
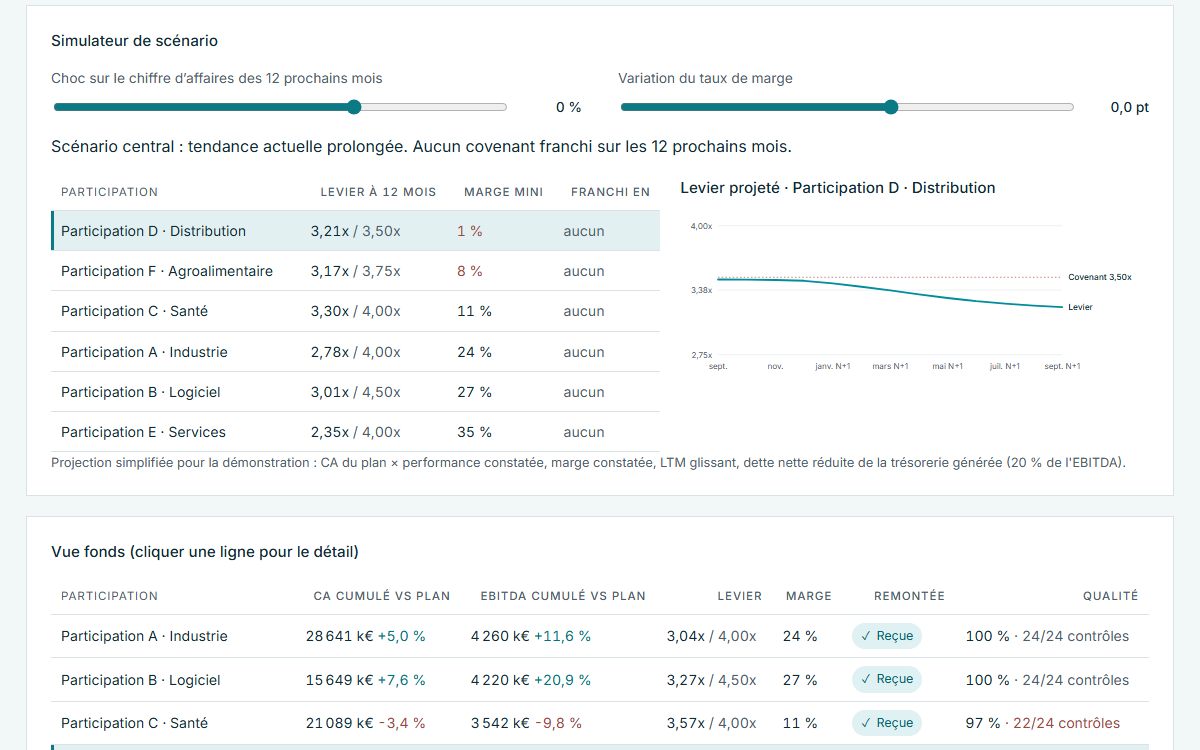
Six portfolio companies on a common basis, quality of each submission checked, and a scenario simulator projecting each one’s leverage over 12 months against its covenant.
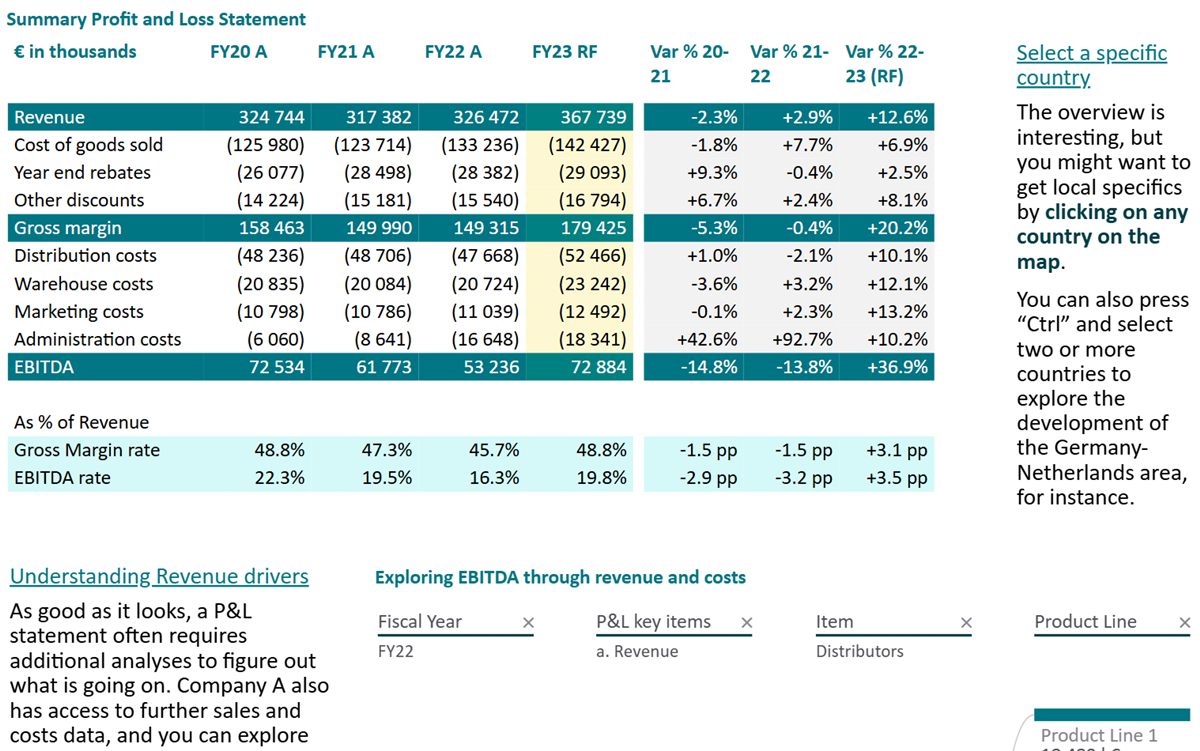
Four-year P&L including reforecast, with variances, geographic footprint by country and an EBITDA breakdown by product and channel.
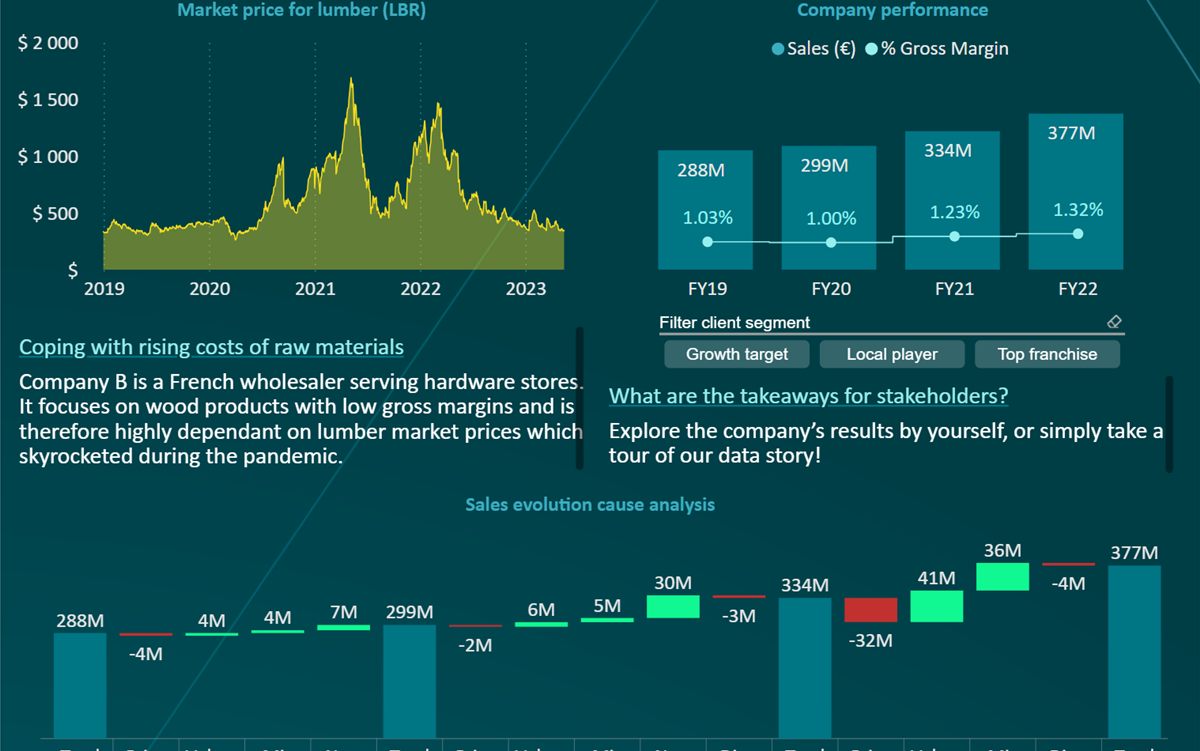
A wholesaler exposed to soaring lumber prices: sales bridged into price, volume and mix effects, customer segments, customer map and top products.
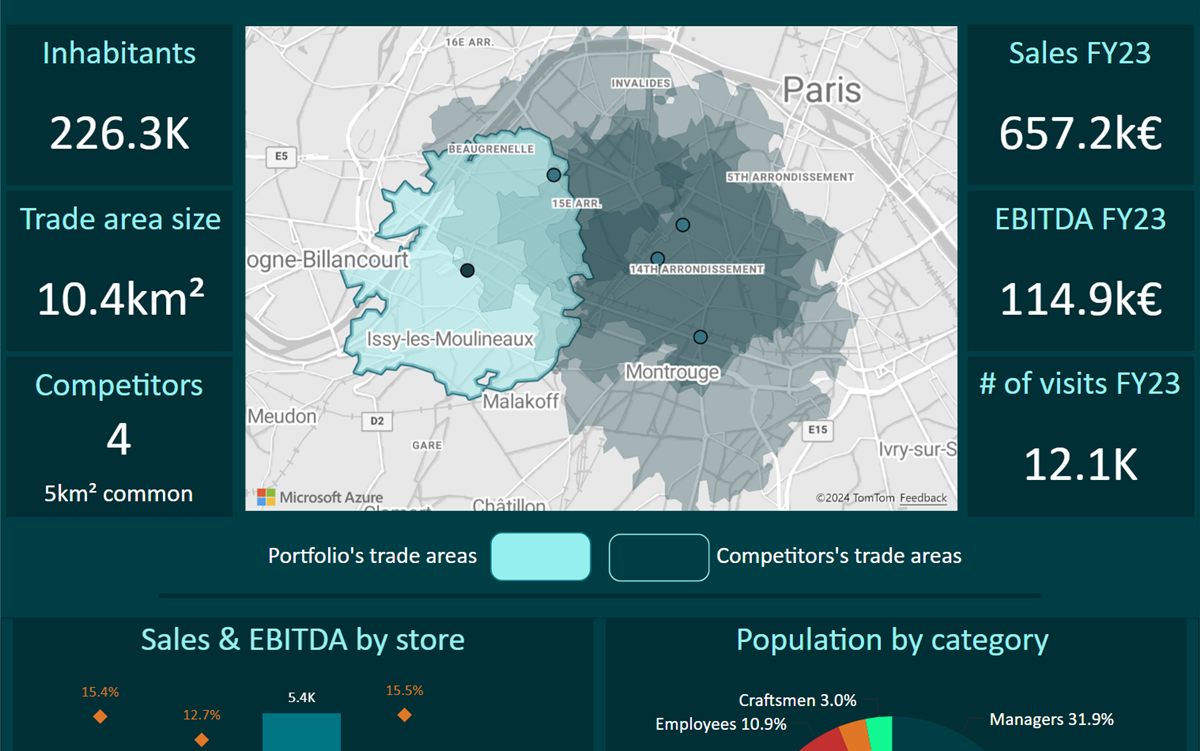
Catchment areas compared with competitors', demographic profile, sales and EBITDA by store, P&L by site.
Interactive demos open on this site; Power BI reports open on the Microsoft site. All data is fictitious.
Start with an assessment
The Flash assessment: 5 days to analyse one specific topic and review your reporting, with a costed roadmap.
Request an assessment